
Article
Export TradingView Chart Data to CSV
TradingView can export price data, but never the analysis you drew on top of it. Here is what the Data Window actually gives you, where the CSV path stops, and a simple structured-export workflow for reviewing your own process over time.

TradingView's Data Window is the little panel that shows the exact OHLC, volume, and indicator values under your cursor. It is great for a quick read. The friction starts when you want those numbers out of TradingView and into somewhere you can actually work, a journal, a spreadsheet, a weekly review. There is no clean one-click path for it, and the copy-paste habit that replaces it quietly falls apart. Here is what is really going on, and the workflow that fixes it.
What the Data Window gives you, and where it stops
The Data Window reads live values at the crosshair for the current chart: open, high, low, close, volume, and whatever indicators you have on. For a quick spot check, that is exactly what you want.
On paid tiers you can also export the chart's price data, the loaded bars and visible indicator plots, to CSV. Useful, and for some jobs that is all you need.
But two things never make it out cleanly. The Data Window values across many bars and sessions stay a manual copy job. And more importantly, none of the work you did on the chart, the support and resistance you drew, the zones, the notes, is in any export. TradingView gives you the market's data, not the analysis you layered on top of it.
Why the copy-paste path breaks the moment you do it twice
The first session, copying values into a spreadsheet is fine. By the third, you have three spreadsheets with slightly different columns.
With no stable structure you cannot compare this week to last, cannot feed the records to a script, and cannot hand them to an AI without cleaning them up first. It stops being a speed problem and becomes a data-quality problem, and your review is only ever as good as the record behind it.
The fix: export the analysis, not just the prices
The move is to treat your chart work as data from the start, a fixed set of fields, captured the same way every session, so the record stays comparable over time.
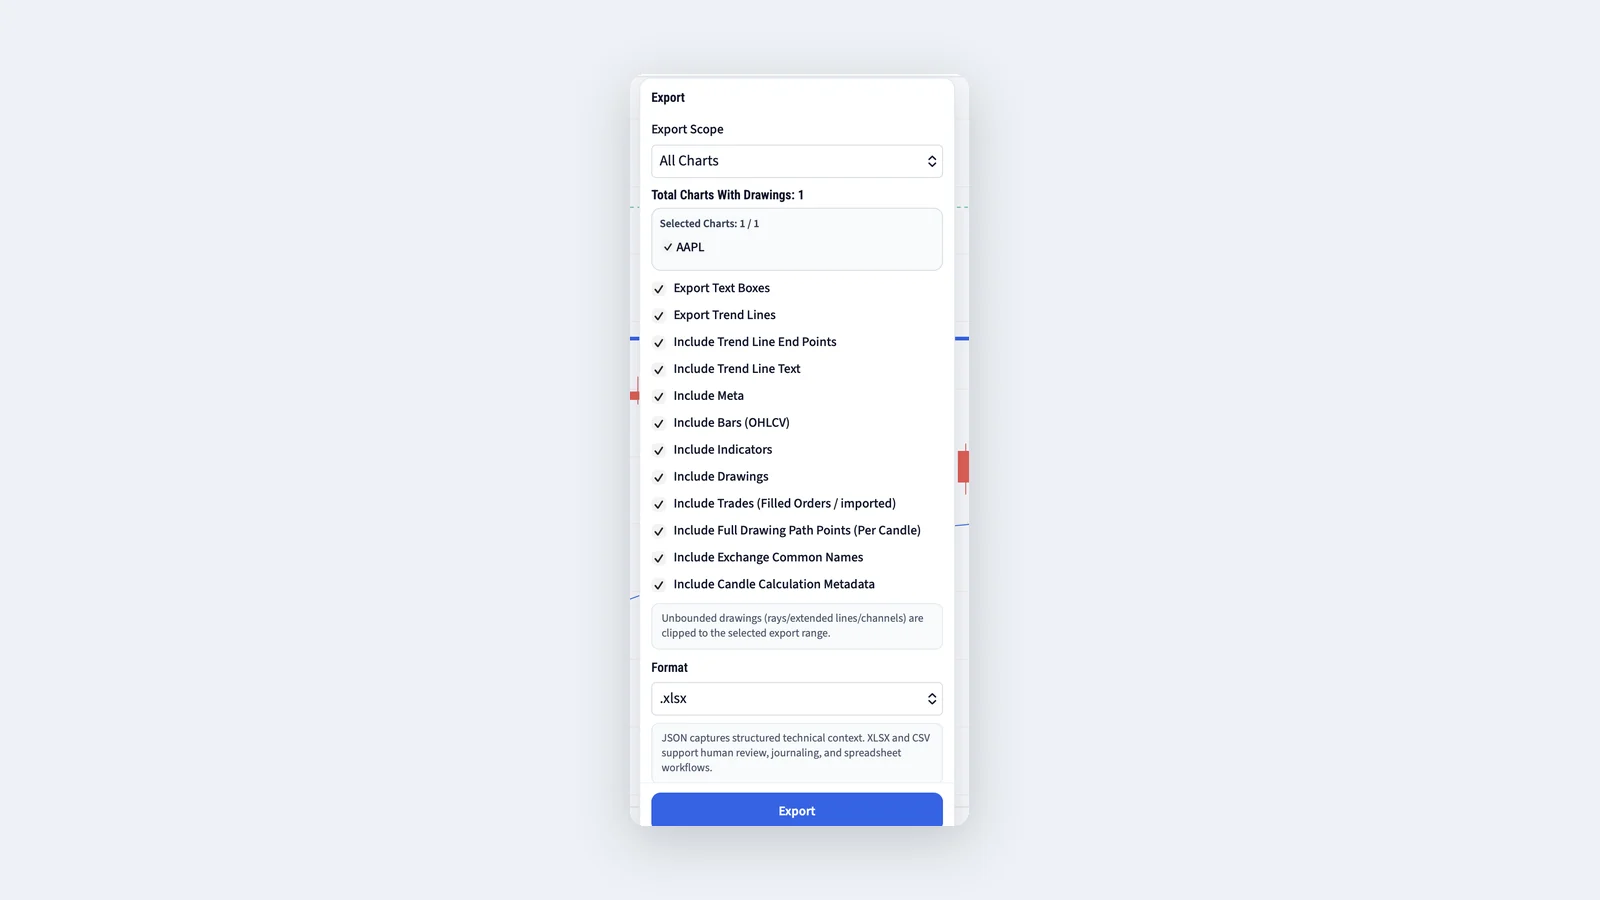
This is the gap MyLinedChart is built for. It exports your drawings, levels, notes, OHLC, volume, and indicators as one structured record in JSON, XLSX, or CSV, so the thing you can never pull out of TradingView, your own analysis, comes out clean and consistent.
- Pick a fixed field set (symbol, timeframe, your levels, notes, outcome) and keep it identical week to week.
- Export at the same checkpoints, end of session is the simplest.
- Because the structure never drifts, comparisons, backtest prep, and AI review just work, no reformatting.
What TradingView is still the right tool for
None of this is a knock on TradingView. As a charting and screening surface it is excellent, and if you just need a quick value read or a one-off price CSV on a paid tier, you are already done, you do not need anything else.
The moment your goal shifts from 'look at the market' to 'review my own process over time,' you need the analysis layer exported too. That is a different job, and it is the one worth setting up properly.
If you want to see exactly what that structured record looks like, see TradingView vs TrendSpider vs MyLinedChart: Structured Chart Exports for Real Trading Processes. To hand it straight to Claude or Codex, see MCP toolkit, or start a trial at Pricing.
FAQ
Can TradingView export the Data Window to CSV directly?
Not the panel itself, it is a live read at the crosshair. Paid tiers can export the chart's price data to CSV, but capturing Data Window values across many bars is still a manual copy.
Why can't I just keep copy-pasting into a spreadsheet?
You can, but the structure drifts every session, so the records cannot be compared, scripted, or reviewed by an AI without cleanup. Consistency is the whole point.
What does a structured export capture that a price CSV doesn't?
Your analysis, the levels, zones, and notes you drew, alongside the OHLC and indicators, in one stable record you can reuse for review.
Does this replace charting?
No. It complements it by giving your process a reusable data layer for review, backtest prep, and AI hand-off.
Sample Structured Chart-Data Exports
Review how chart drawings, annotations, OHLC, volume, and execution context become reusable structured data.