
Draw your trading strategy. Let AI do the rest.
AI-Assisted Trader
I want AI to do the analysis with me.
See your AI in actionDiscretionary Trader
I've done the analysis.I just don't want to draw it.
See it drawQuant Trader
I want the full analysis as reusable data.
See what exportsMacro Trader
My analysis isn't technical.I still need it on a chart.
Get the levels without the chartingSee it on your devices
Shown in your language.
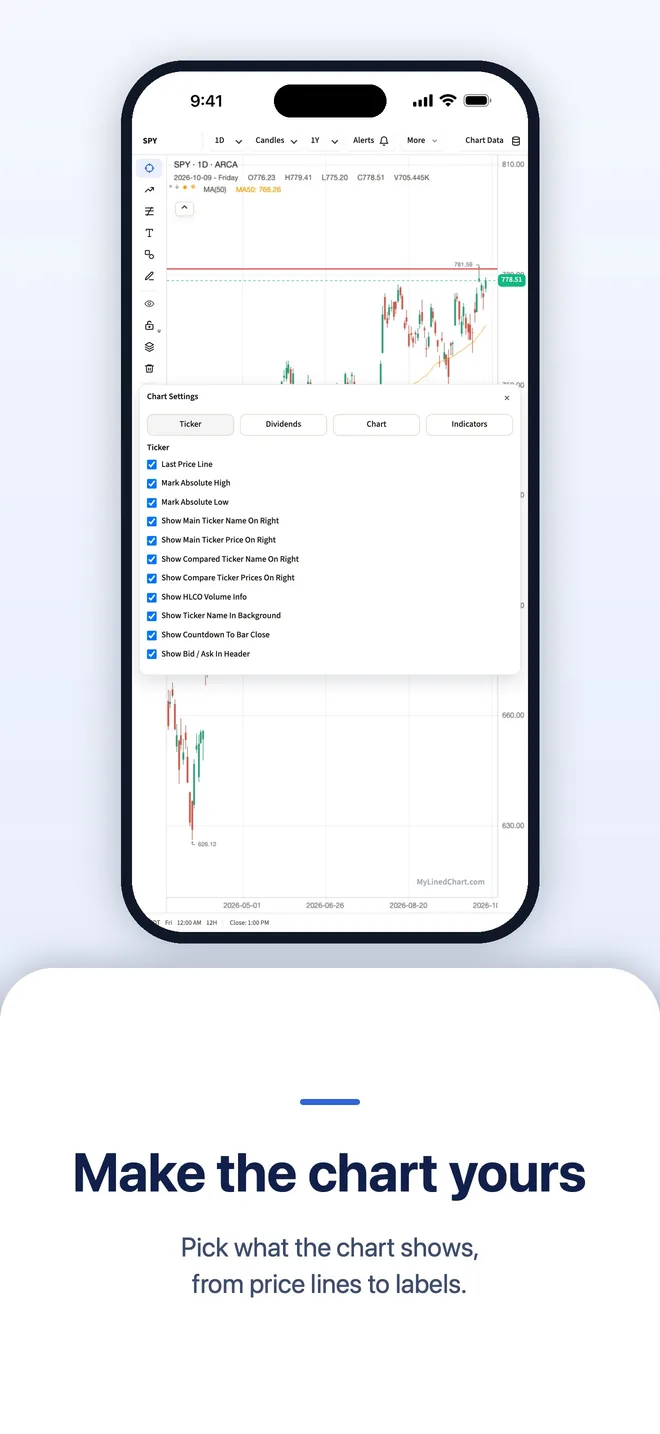
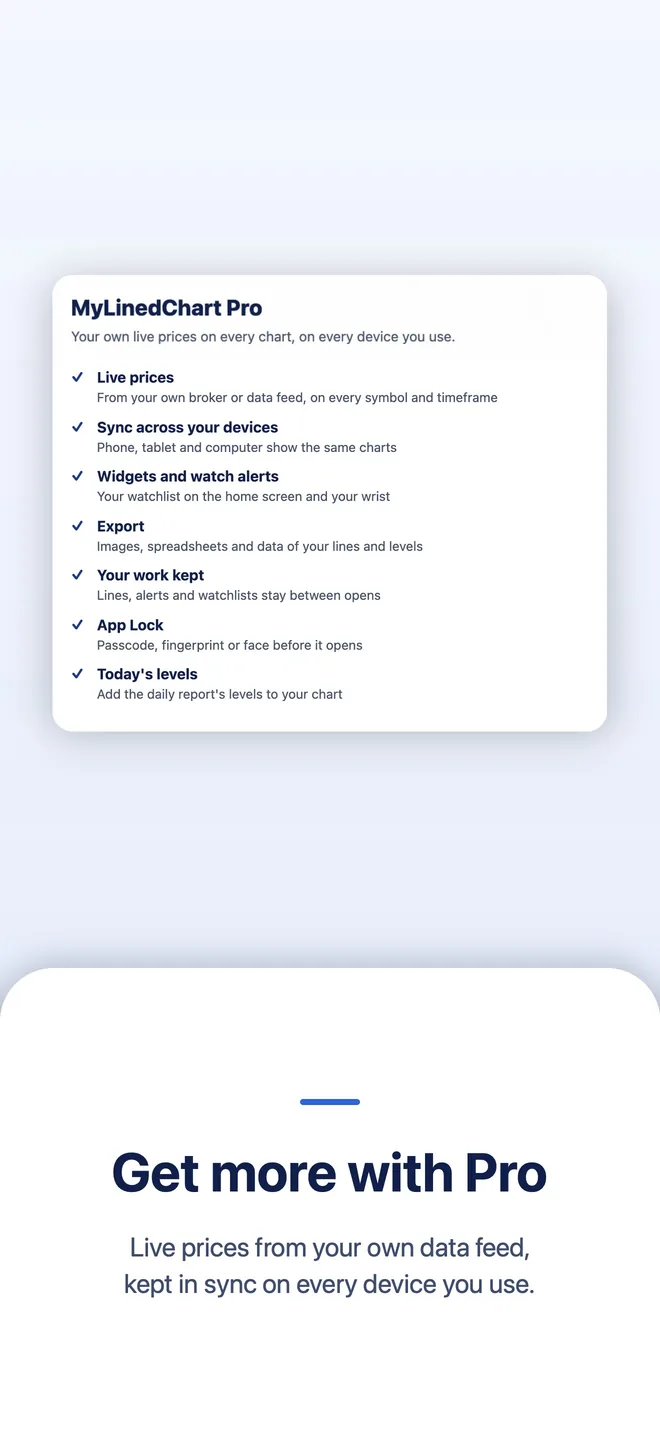
Your analysis belongs to you. MyLinedChart finally makes your analysis usable.
A screenshot is where your chart analysis dies. MyLinedChart exports your lines, levels and notes as data you and your AI can use.
Free download for Apple, Android, Windows and Linux.
| Feature | MyLinedChart | TradingView^ | TrendSpider^ |
|---|---|---|---|
| Your drawings, levels & notes | CSV · JSON · XLSXTrendlines, zones, labels and your written notes as structured data. | Not possibleNo export, any tier, any format | Not possibleNo export, any tier, any format |
| Price bars & indicator values | CSV · JSON · XLSXIn the same file as the drawings | CSV onlyLocked below $34.95/mo | CSVXLSX for backtest results only |
| Everything as one record | Every chart, one fileDrawings, notes, OHLC, volume and indicators together | Not possibleBars only, one chart at a time | Not possibleA separate export per tool |
| What it costs | Everything included for one flat priceFrom $16.67/mo billed yearly, $24.99 monthly, or $699.99 once | 4 paid tiers$14.95 to $239.95/mo | 4 paid tiers$82 to $321/mo |
| Use your own AI | Your device's AI or the AI you already useSiri AI, Gemini Nano, Windows AI, Claude, ChatGPT or Gemini, in the chart's own chat | Sold by the monthAI Copilot, $7.50/mo on top of the plan | Sold by the message$49 to $349/mo on top of the plan |
| Tickers per watchlist | 5,000Unlimited lists, up to 5,000 in each. | 1,000Unlimited lists, capped at 1,000 each. | 700+ prebuilt listsTheir lists. |
| Alerts | No cap, no expiryAny screener condition. Your device does the watching. | 20 to 1,000 by tierNo watchlist alerts below $69.95/mo. | 10 to 400 by tierExpire after 30 to 365 days. |
| Connect your own broker | 25+ brokers & data feeds across the globeYour keys, your account, read-only | Their data2 to 6 subscriptions by tier, $1 to $132/mo each on top. | Their data+$7.50 · +$9.50 · +$29/mo add-ons |
| Backtesting | Export it, your AI runs itAs far back as your own data goes. | Deep backtestingFrom $69.95/mo | 2K to 30K candles+$39/mo to lift the lower tiers |
| Drive it from your AI agent | 10 tools, direct connectionClaude, Cursor, Codex and Gemini read the chart itself | Data and alerts, no chartOfficial MCP beta (Sept 2026), Essential plan and up; no drawing tools | Not offered |
| AI headlines at your moving-average dates | Marker + AI summary at each SMA dateBuilt-in news search with source links, or your IBKR news or AI | Chart news markers without SMA anchoringScheduled events + AI Copilot, tied to the current moment | Sidebar list beside the chartBenzinga headlines for the symbol, no date anchoring |
| Getting to execution | Three ways to executeYour broker's own ticket, your AI turning the export into code, or your own script. | In-platform order ticketsTrade from the chart | In-platform, plus botsOrder entry and automated bots |
Try MyLinedChart Now
Follow the prompts in the chart
Get MyLinedChart on:
Apple: iPhone, Apple Watch, iPad, Mac, plus widgets
Android: Android phones, Wear OS, Android tablets, Chrome OS Chromebooks, Googlebook OS laptops, plus widgets
Windows: Windows PC desktops, plus widgets
Linux: AppImage for Ubuntu, Fedora, Debian and most other desktops
Using TradingView? Download a sample Pine Script and import it under Formula.
Pro features shown.
Why I Created MyLinedChart

Hi- I'm Lee. I built MyLinedChart to fill a gap I couldn't find a solution for anywhere else: no charting platform lets you export your drawings, notes, and full chart context as data. I got tired of being stuck with screenshots, manually copying out levels, lines, and notes, and leaving my hard work locked in other platforms.
So I built MyLinedChart. Then took it a step further and added an AI integration (MCP) so Claude, ChatGPT, Cursor, Gemini, or your favorite AI agent gets a full view of your charts. Tell it to add your drawings, notes, and create custom indicators, or let it do all the work for you. Everything on your screen is exportable to JSON, XLSX, and CSV.
You can check out the demo above. When you're ready, get started with your free trial. Everything is handled securely through Stripe and, just like the list of globally supported brokers, data providers and alt data, is never routed through my servers.
Cheers -Lee
You can also check out my other apps Reveal the Dream, The Long View, Still Dock, Keep the Diff, Copy Shelter, and Prompt Petal
Pro, on every device
Your work follows you
Sync across your devices
Your chart set-up, lines, indicators, watchlists, alerts and layouts stay in step on every device you sign in to. Keys, broker logins and prices stay on each device. If two devices changed, you pick which version to keep.
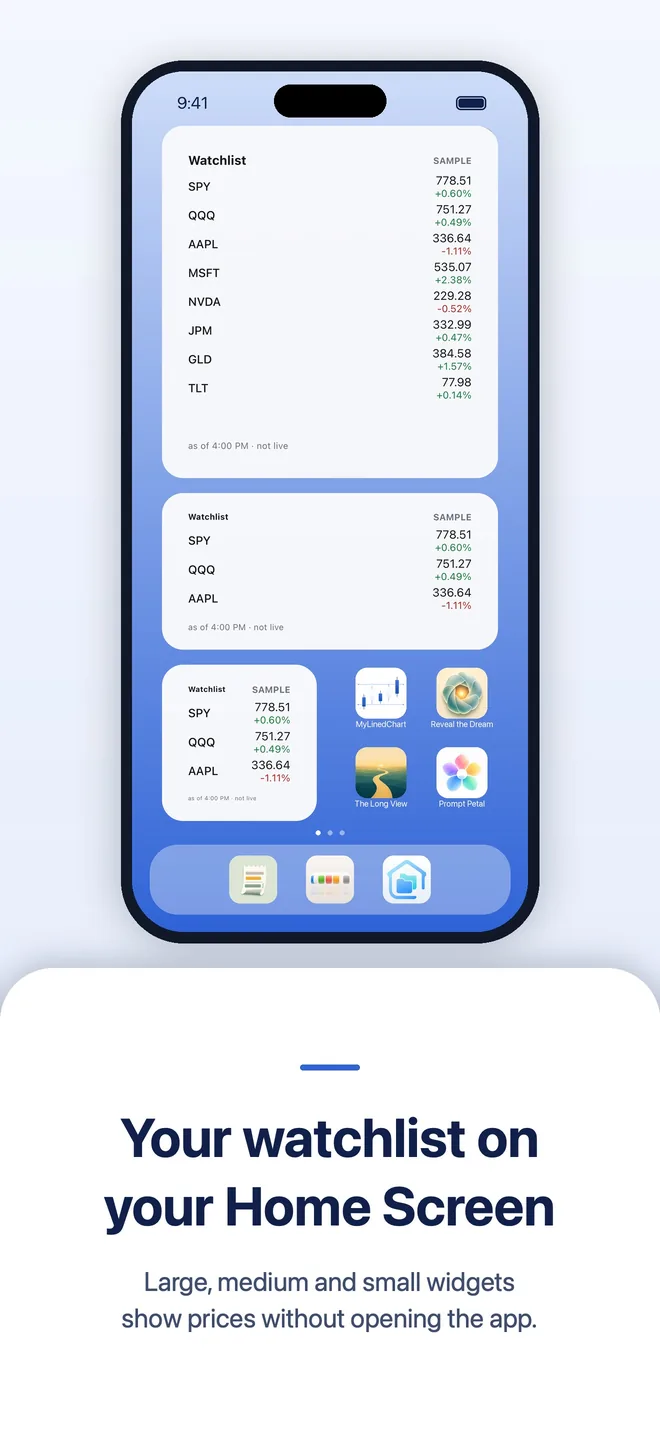
Home Screen widgets and watch
Large, medium and small widgets show your watchlist prices without opening the app, on iPhone, iPad, Android and Mac, plus Apple Watch and Wear OS.
App Lock
Lock MyLinedChart with Face ID, Touch ID, your fingerprint or your Windows sign-in, when it opens and after you step away.
Today's levels on your chart
Little Bird Trading's daily report shows in News for the symbol you chart, and Add today's levels draws those levels on your chart.
Welcome Guide
A short guide walks you through connecting your data, setting up AI, drawing a line, setting an alert, widgets, export and App Lock, with a picture for each step.
Back up your workspace
Save every chart, drawing, watchlist and layout to one file on your device, and open it again on any computer.
Start communicating with your charts
Make your AI your trading partner. Your AI can also do all the work for you
MyLinedChart gives your live chart and workspace context to AI agents: Claude Code, Codex, Gemini, Cursor, Perplexity, or your preferred one.
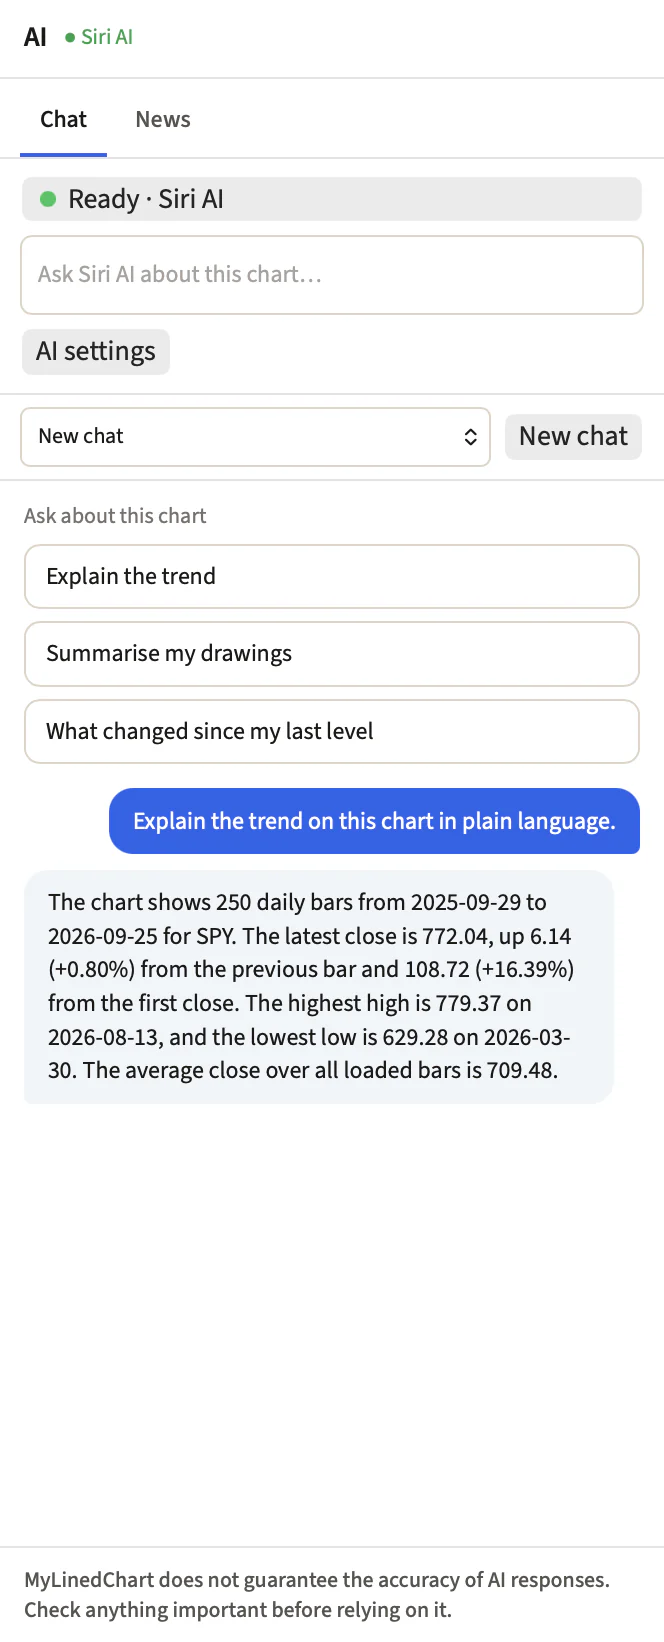
MyLinedChart does not guarantee the accuracy of AI responses. Check anything important before relying on it.
Export it, then trade it
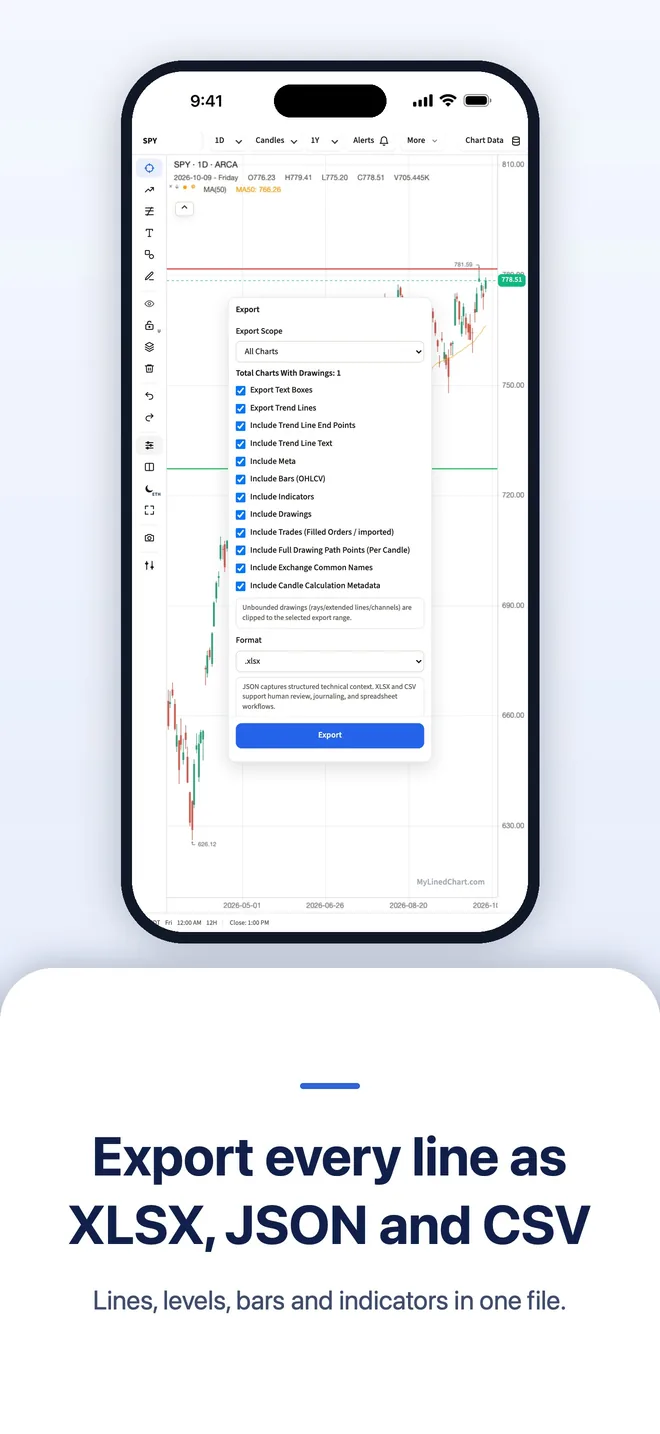
Every chart. Every markup. One file.
Drawings
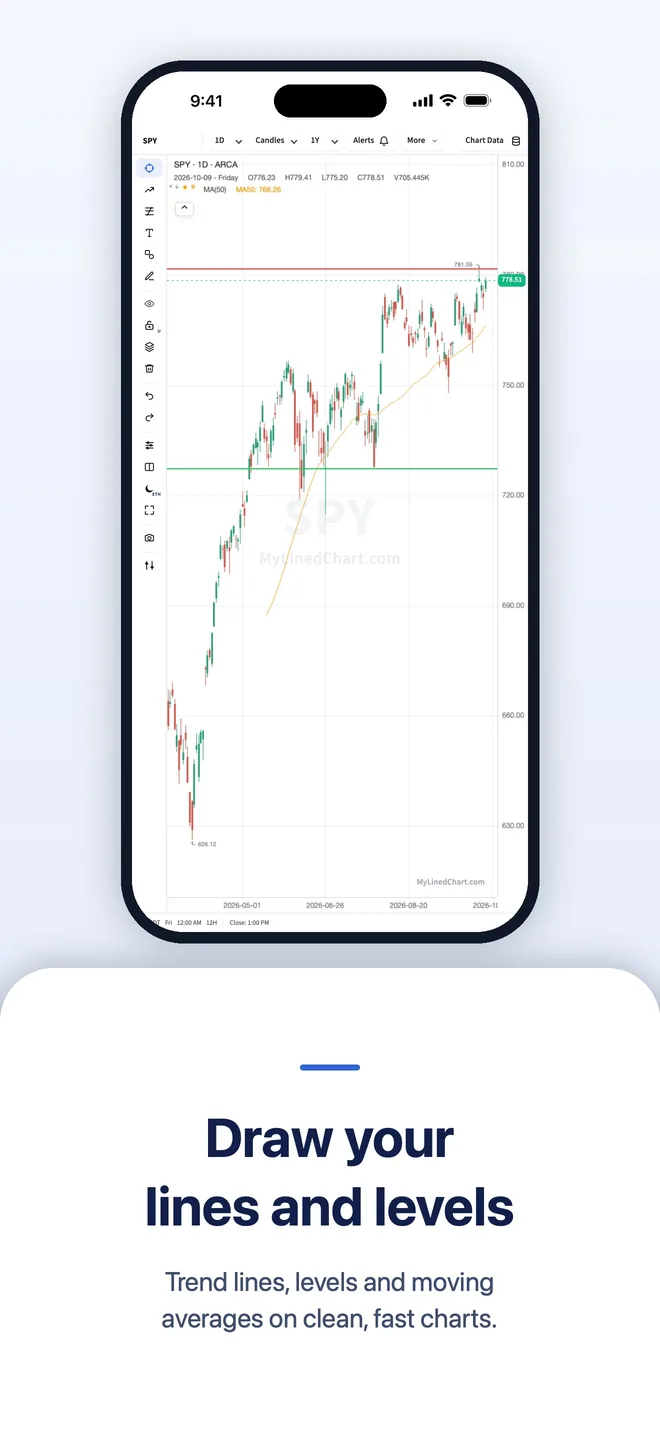
Trendlines, callouts, and markers saved as part of the record with their prices and dates.
Levels & Zones
Support, resistance, targets, and risk areas captured for reuse.
Notes
Your setup logic, hypotheses, and reminders stay attached to the chart.
Indicators
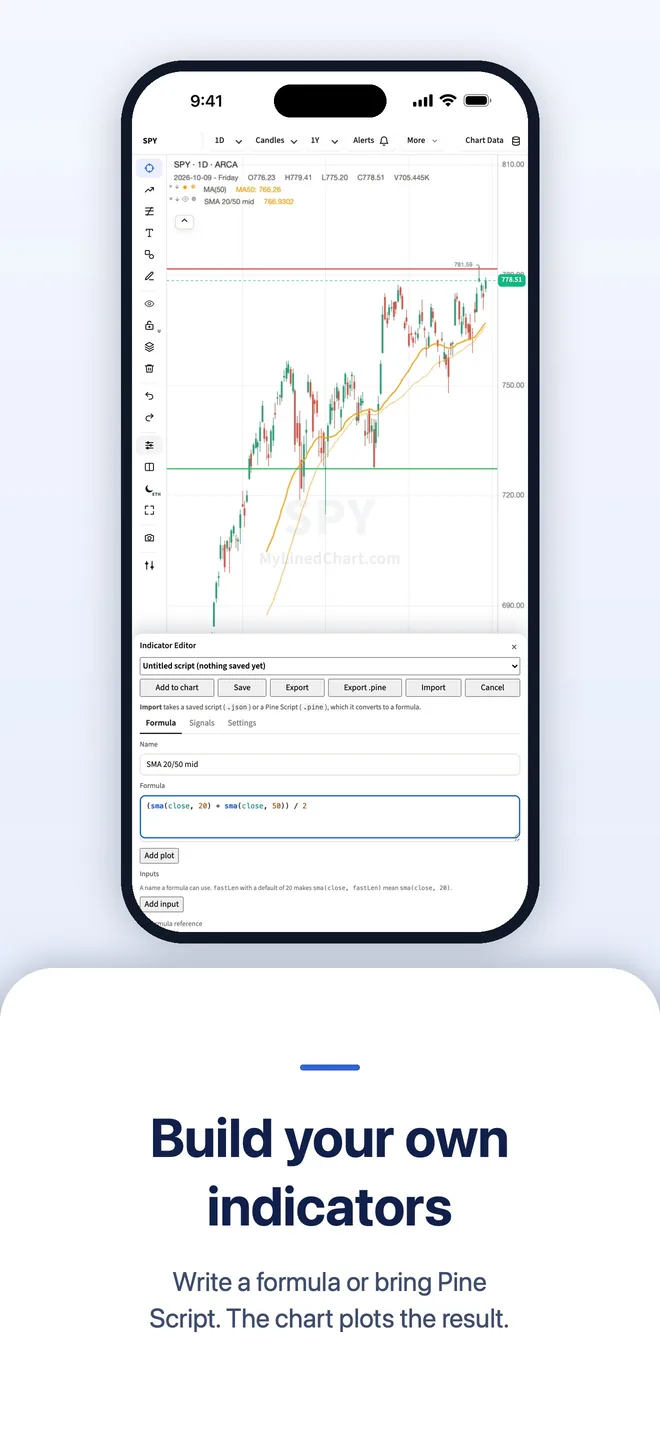
A full library of built-in indicators (MA, EMA, BOLL, MACD, RSI, VWAP, and more) plus custom formula indicators you, or your AI, invent, travel with the work you inspect later.
Integrate your broker, data provider or alt data subscription
MyLinedChart is for traders all across the globe.
 Interactive Brokers (IBKR)
 Charles Schwab
 Alpha Vantage
 Financial Modeling Prep
 EODHD
EODHD Marketstack
 Binance
 Coinbase
 Kraken
 OKX
OKX Bybit
Bybit Finnhub
 Twelve Data
 Massive (Polygon)
 Tradier
 Alpaca
- Composer by SoFi
 OANDA
OANDA Saxo
Saxo Upstox
 Dhan
Dhan Fyers
Fyers Questrade
 Zerodha
 Angel One
 ICICI Direct
 Kotak Securities
 IG Markets
Don't see yours listed? Use the button below and we usually add it within 24 hours.
Alt Data Providers
- SpotGamma
- MenthorQ
- Gexbot
- Unusual Whales
- SqueezeMetrics
- FlashAlpha
- Volland (Addeum)
- GEXStream
- Perspicium
- InsiderFinance
- Tier1Alpha











All chart data dependent on your data subscription. No offer is being made or guaranteed on the accuracy of your data provider. Your credentials stay local to your device, they are never sent to MyLinedChart servers.
Built for how you actually trade
The full charting toolkit
Sync across your devices
Charts, lines, watchlists and alerts on every device you sign in to.
Widgets and watch
Large, medium and small widgets, plus Apple Watch and Wear OS.
App Lock
Face ID, Touch ID, fingerprint or your Windows sign-in.
Today's levels
Little Bird Trading's daily levels, drawn on your chart.
Welcome Guide
Step by step, from your data to your first alert.
Back up your workspace
Every chart and drawing in one file you keep.
10 chart types
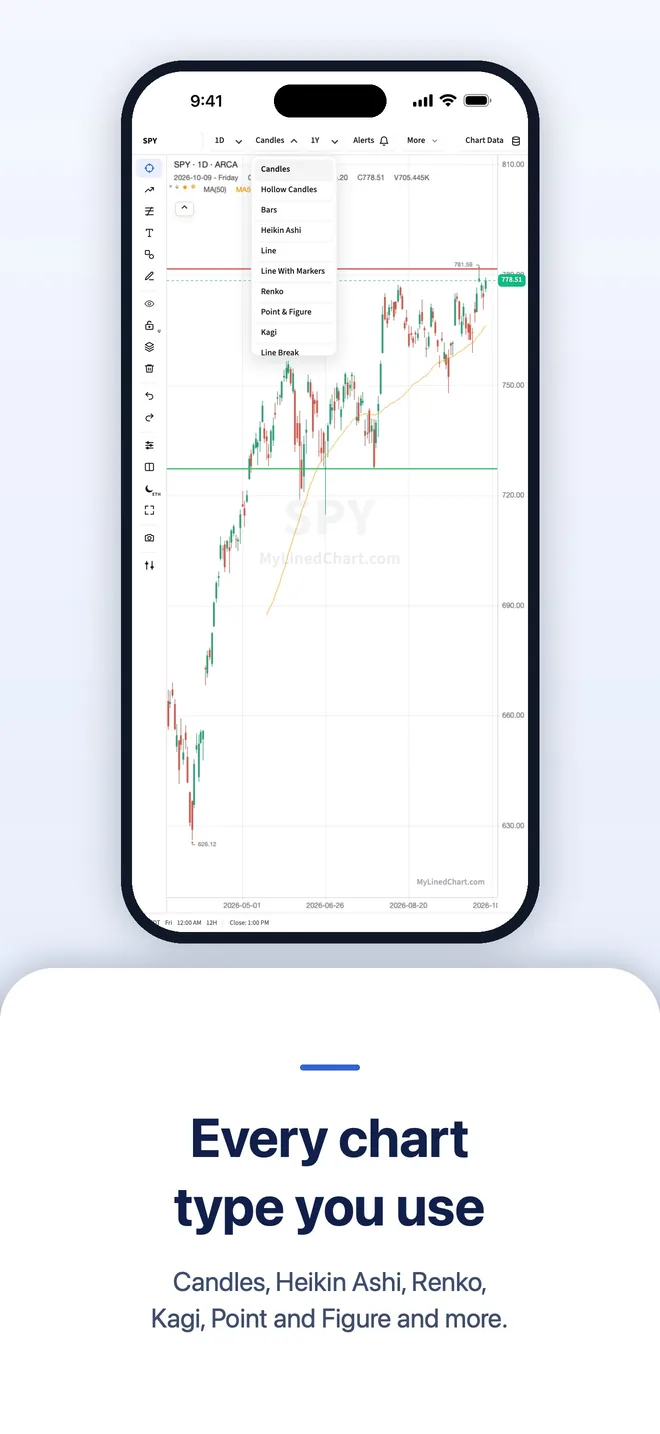
Candles, Heikin Ashi, Renko, Kagi, Point & Figure, Line Break, and more, selectable per pane.
Compare symbols
Overlay multiple symbols on one chart, normalized, each in its own color.
Split screen
Up to four fully independent panes, each its own symbol, timeframe, indicators, and drawings.
Watchlists
A panel that docks beside the chart. Up to 5,000 tickers per list, and as many named lists as you want.
Screener
Screen your own watchlist on price, volume, moving averages, RSI and N-day highs and lows, or write your own formula.
Alerts
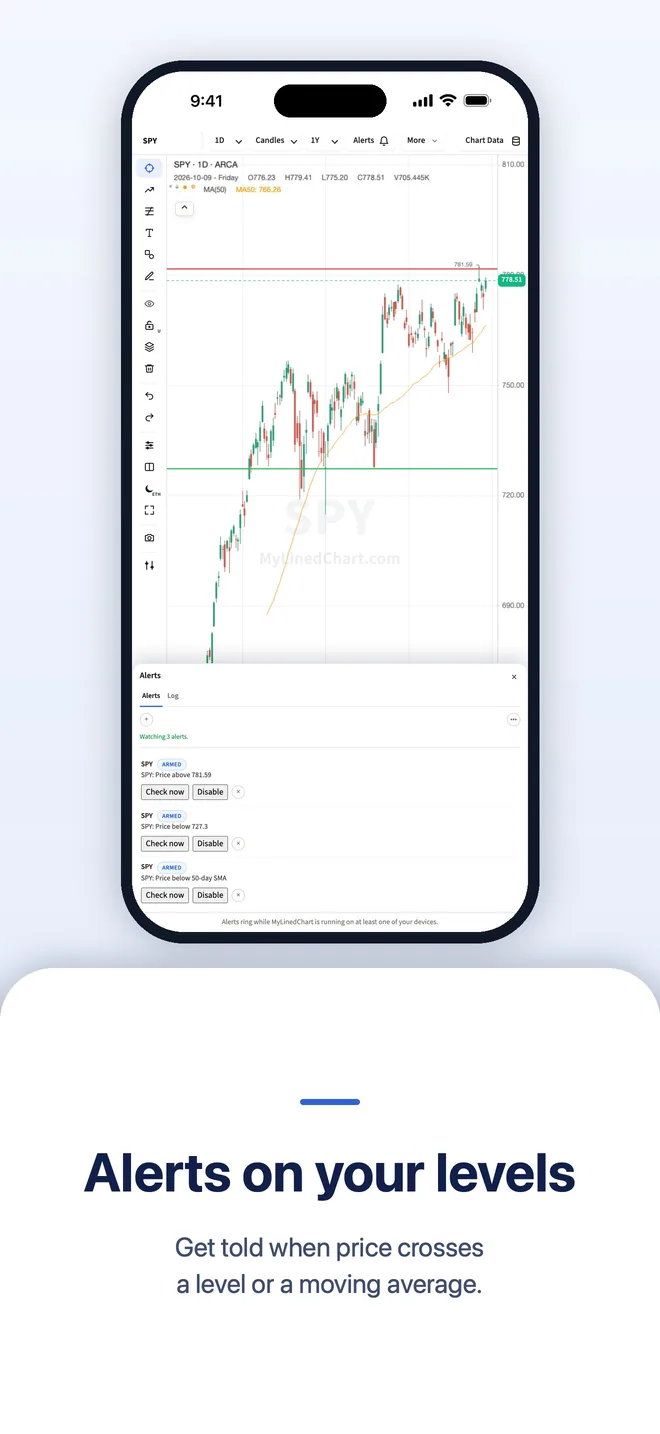
Any screen you can build can sit and watch one symbol. The screen alerts you through your own Telegram bot, with no cap on how many screens you keep and no expiry date on any of them.
Per-chart time zones
Each chart keeps its own market's time, Tokyo for N225M, Singapore for the MSCI Singapore future, Frankfurt for ESTX50, Madrid for IBEX, and asks before switching.
AI Headlines at your moving averages
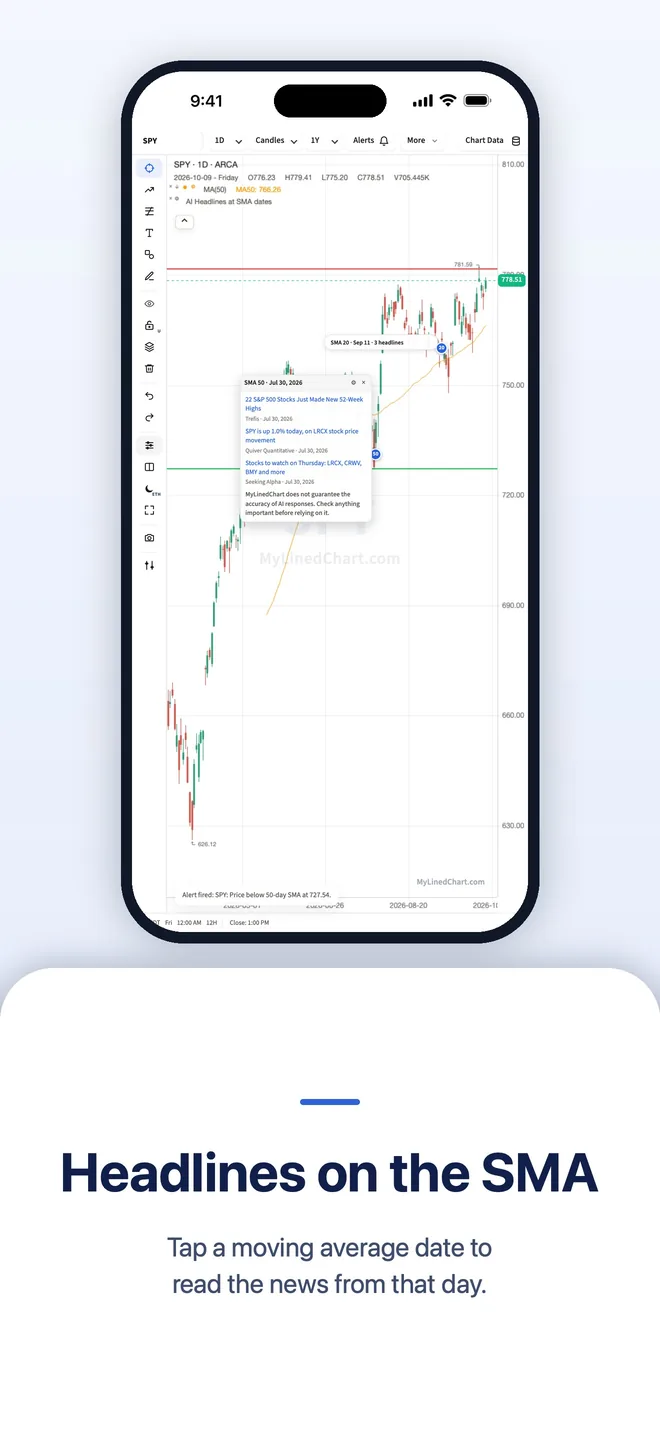
See the news from the day your 20, 50 and 200 day moving averages start. Linked headlines show right away, from a news search your device runs itself. Your IBKR news feed, your connected AI, or your own Finnhub or Polygon key can add more.
Ask your AI about your chart
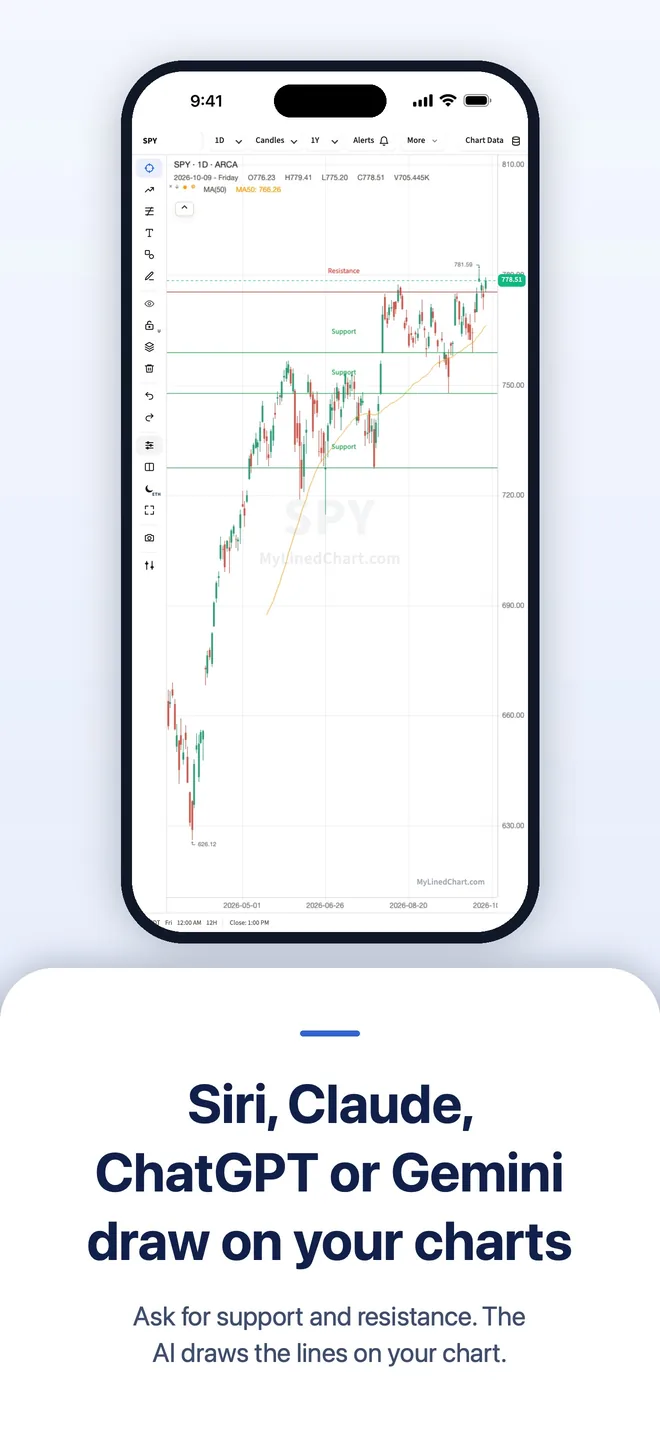
Chat with the AI built into your device: Siri AI on iPhone, iPad and Mac, Gemini Nano on Android, Windows AI on Copilot+ PCs. Or use Claude, ChatGPT or Gemini, or on the direct download an AI app you connected. Your AI explains the trend, your drawings and your last level from numbers the app works out itself, and marks the key levels on the chart when you ask. Chats stay on your device.
News for the symbol on screen
Every recent headline for the chart you are on, in a scrolling list with links to their sources and a Share button on each. Open News in its own panel beside the chart, or as a tab inside the AI panel. Headlines your AI found are marked as coming from your AI.
TradingView Pine Script import and export
Import a Pine Script and it opens as a formula indicator, keeping its own name and its own pane. Export any custom indicator as a Pine Script to use in TradingView.
Your positions beside the chart
A Positions panel lists your open IBKR and Composer positions with IBKR's own last price and P/L. Sort by any column, and pick the columns you want: market value, P/L percent, realized P/L, today's change, percent of portfolio, account and currency. Click a position to load its chart. On the direct download, with TWS or IB Gateway connected, your open positions also show as lines at your entry price, and you can turn them off in Chart Settings. Read-only: the app never places an order.
Moving averages, up to 20 at once
One MA indicator draws as many as 20 lengths, each line in its own color, so the 20, 50 and 200 day averages sit together in one legend row.
Ask ChatGPT or Claude about the chart on your desktop
Add MyLinedChart in ChatGPT or Claude, then turn on the switch in the desktop app's AI panel. ChatGPT or Claude can then read the chart you have open, and any lines they suggest wait for your approval. Works while the desktop app is running, with a Pro plan.
Share and feedback in one place
Share MyLinedChart, rate the app, visit the website, request a feature or report a bug from the same menu, with an icon on each. On a phone, Settings sits in the toolbar's More menu.
You bring the thesis. Your AI brings the levels.
You trade rates, growth, positioning, a catalyst. Before the trade goes on, you still want to know where support sits if you are wrong, and where resistance sits if you are early. Ask in plain language and your AI draws them, labelled, on your chart.
Ask, don't draw
“Mark the key support and resistance.” Your AI reads the chart and puts the lines on it. No charting to learn.
Levels for entry and risk
A level to lean on, and a level that says you are wrong. Those two levels are enough. Your macro idea does not become a technical one.
The levels leave with your notes
Support, resistance and your written thesis export together as JSON, XLSX or CSV, so the why and the where stay in one record.
Your AI reads the chart and draws on it. It never places, sizes or routes an order.
How macro traders use itFAQ
Questions traders ask
What is MyLinedChart?
MyLinedChart is a charting app that turns your trendlines, levels, zones, and notes into structured data (XLSX, CSV, JSON) you can use to build trading rules, yourself or with your AI.
Does MyLinedChart work with Interactive Brokers (IBKR)?
Yes. MyLinedChart connects to IBKR through the TWS and IB Gateway desktop apps.
Does MyLinedChart work with other brokers like Schwab, data providers like Alpaca, and alt data providers like SpotGamma?
Yes to all three. MyLinedChart already integrates with most major brokers and data providers, and more are added all the time. Don't see yours listed? Send a request from the Help Center.
Do I need my own market data subscription?
For stocks and futures, yes: charts use your broker account or your data provider's API key, and MyLinedChart never resells market data. Crypto charts from Binance, Coinbase, Kraken and OKX need no account.
Can my AI see and draw on my charts?
Yes. A direct connection lets AI agents like Claude Code, Codex, and other MCP-capable clients read your live chart context and propose drawings, custom indicators, and view changes that you confirm. It never touches your brokerage account and never places trades.
Do I have to use the AI features?
No. The AI features are there to make traders' lives easier, and they are completely optional.
Does MyLinedChart include a Claude Code, Codex, Gemini, or other AI subscription?
No, and you do not need one. The AI built into your device (Siri AI, Gemini Nano or Windows AI on Copilot+ PCs) works with no subscription. You can also use Claude, ChatGPT or Gemini, or on the direct download connect an AI app you already pay for, like Claude Desktop.
Is my trading data private?
Yes. Your charts load on your device, and your broker logins and API keys stay on that device. They are never sent to MyLinedChart servers. With Pro sync on, your chart set-up, drawings, watchlists, alerts and layouts are stored for your account so they reach your other devices; keys and logins are removed first.
Is there a free trial?
Yes. Check out the Pricing page to learn more.