
ABOUT MYLINEDCHART

Built.for You.

MyLinedChart is built by a trader who's run IB algos for 10+ years — for Interactive Brokers traders.

OTHER PLATFORMS

Trader Second

Most platforms want traders to create more custom indicators, rely on AI to find an edge for them, or figure out whose edge they should copy-trade.
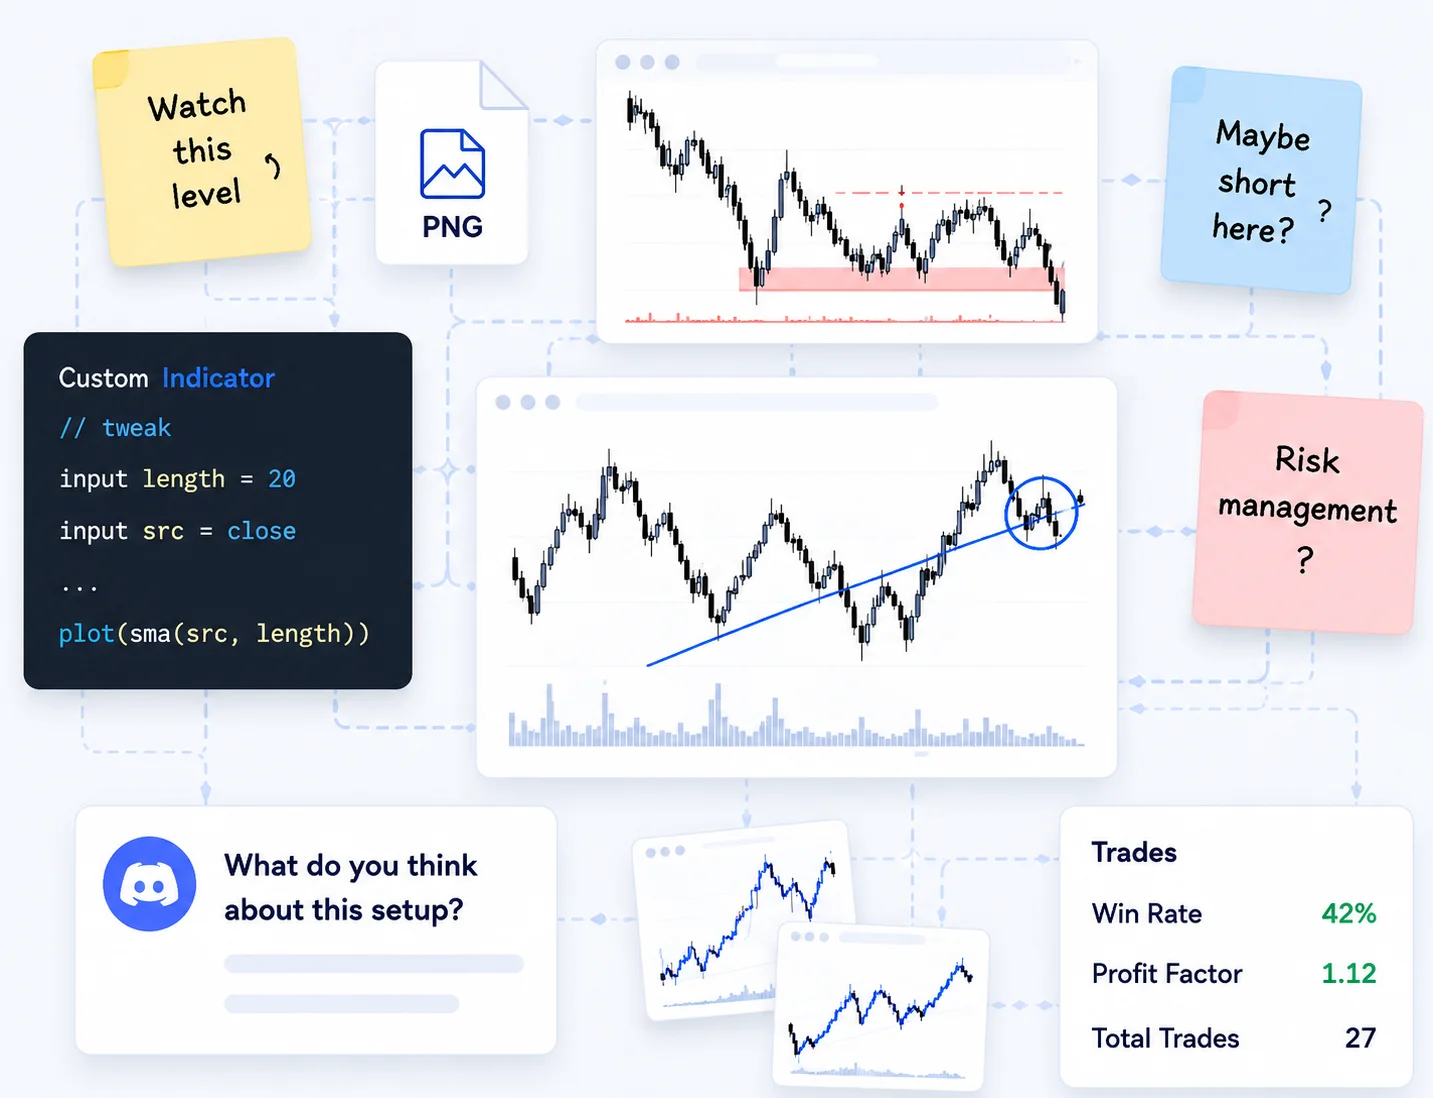
Disconnected technical analysis workflow using screenshots, notes, custom indicators, and scattered trading context.

MYLINEDCHART

Trader Process First

MyLinedChart was designed for traders who use technical analysis to bring clarity, refinement, repeatability, and better decision infrastructure to compound their edge.
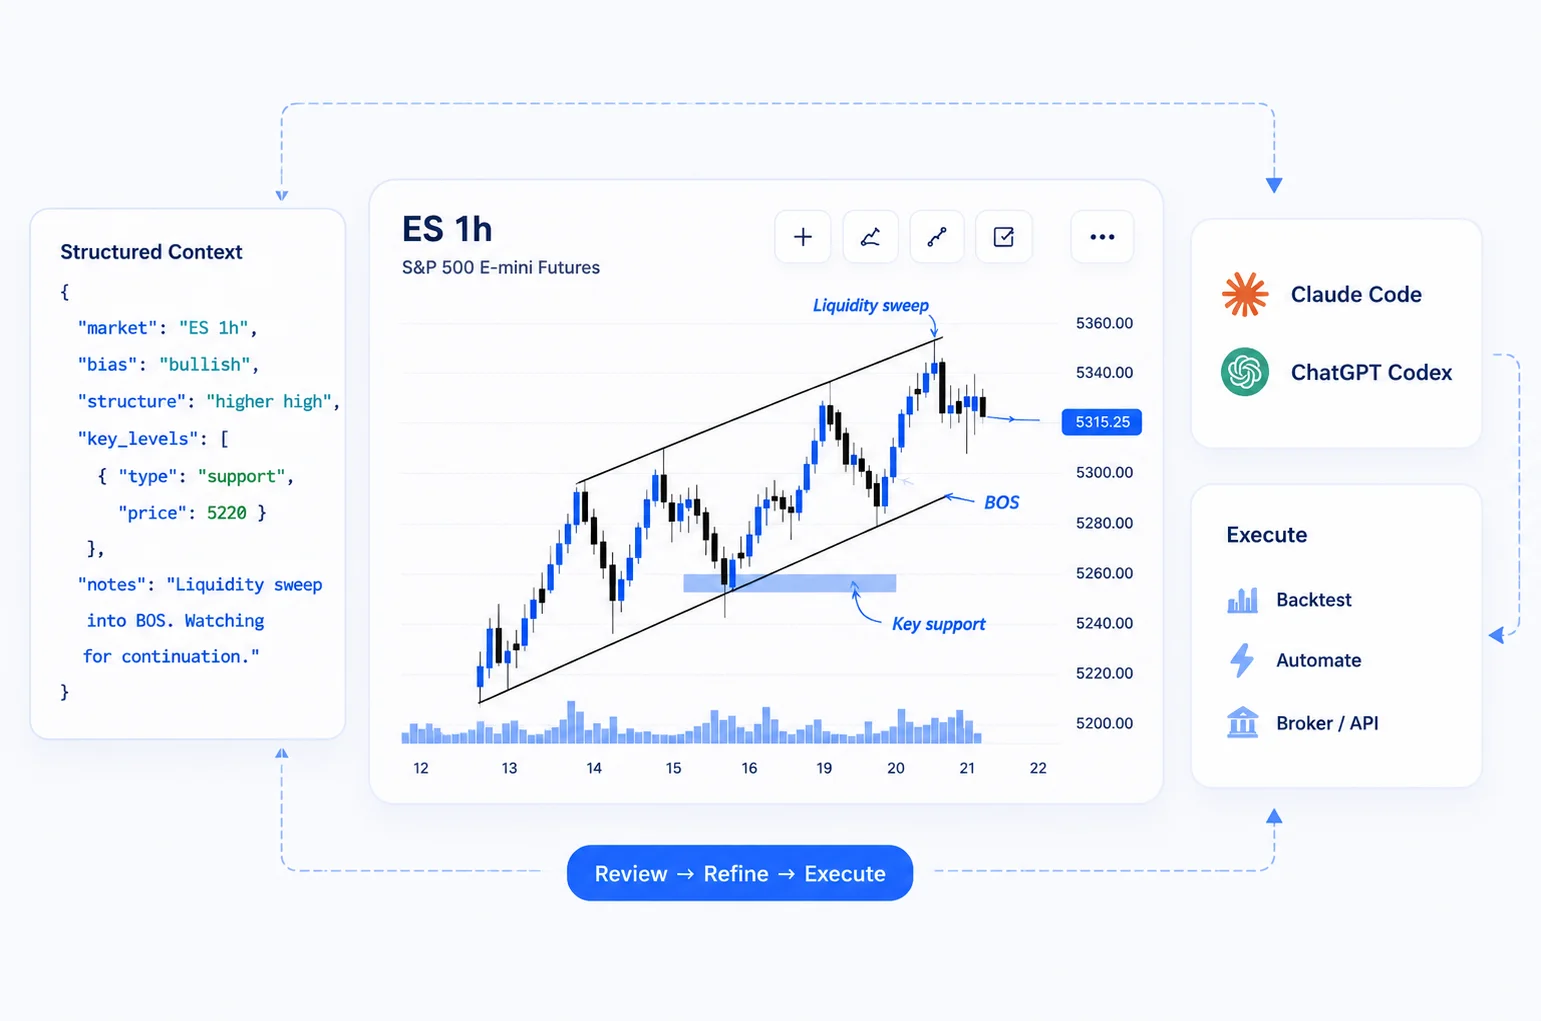
Structured chart-data workflow connecting chart context, Claude Code, ChatGPT Codex, and broker API execution planning.

WHY LOCAL, BY DESIGN

Compliant by Design, Not by Accident

MyLinedChart is a local desktop app for one deliberate reason. The obvious way to build it — a cloud service streaming charts from our servers — would make us a market-data redistributor in the exchanges' eyes. Going that route through IBKR means a ~$60k Web API integration fee, and exchange market-data licenses on top of that (a separate, additional cost), plus a 250-active-user gate before you can even apply.

So we built the other way. The app runs on your machine, connects to your own IBKR session, and shows data under your own subscriptions — nothing streams through our servers, so there is no redistribution. Your data stays yours, and the product is compliant by design. That same constraint shaped the AI layer: since the edge isn't a cloud data feed, it's letting an AI operate your local chart — confirmation-gated, never your orders.

The full reasoning is in how to legally display IBKR market data, and the connector detail is on The Connector. (Educational, not legal advice.)

STRUCTURED DATA

Start Capturing Your Edge

10+ years building automation and proprietary algorithms on Interactive Brokers, across global markets and every major asset class. MyLinedChart is the tool built from that workflow.

  • Chart Drawings and Annotations
  • Decision and Execution Context
  • Trendlines, zones, labels, notes
  • Review-ready trade history
  • Indicators, OHLC, volume, logos
  • Claude Code / ChatGPT Codex ready
  • JSON, XLSX, and CSV exports
  • Automation-ready data