
1. Has a CSV or an API?
Point your AI at it, and it draws the levels on your chart. Works with SpotGamma's daily CSV, MenthorQ's API, Gexbot, Unusual Whales, SqueezeMetrics, and FlashAlpha.
Alt Data on Any Chart
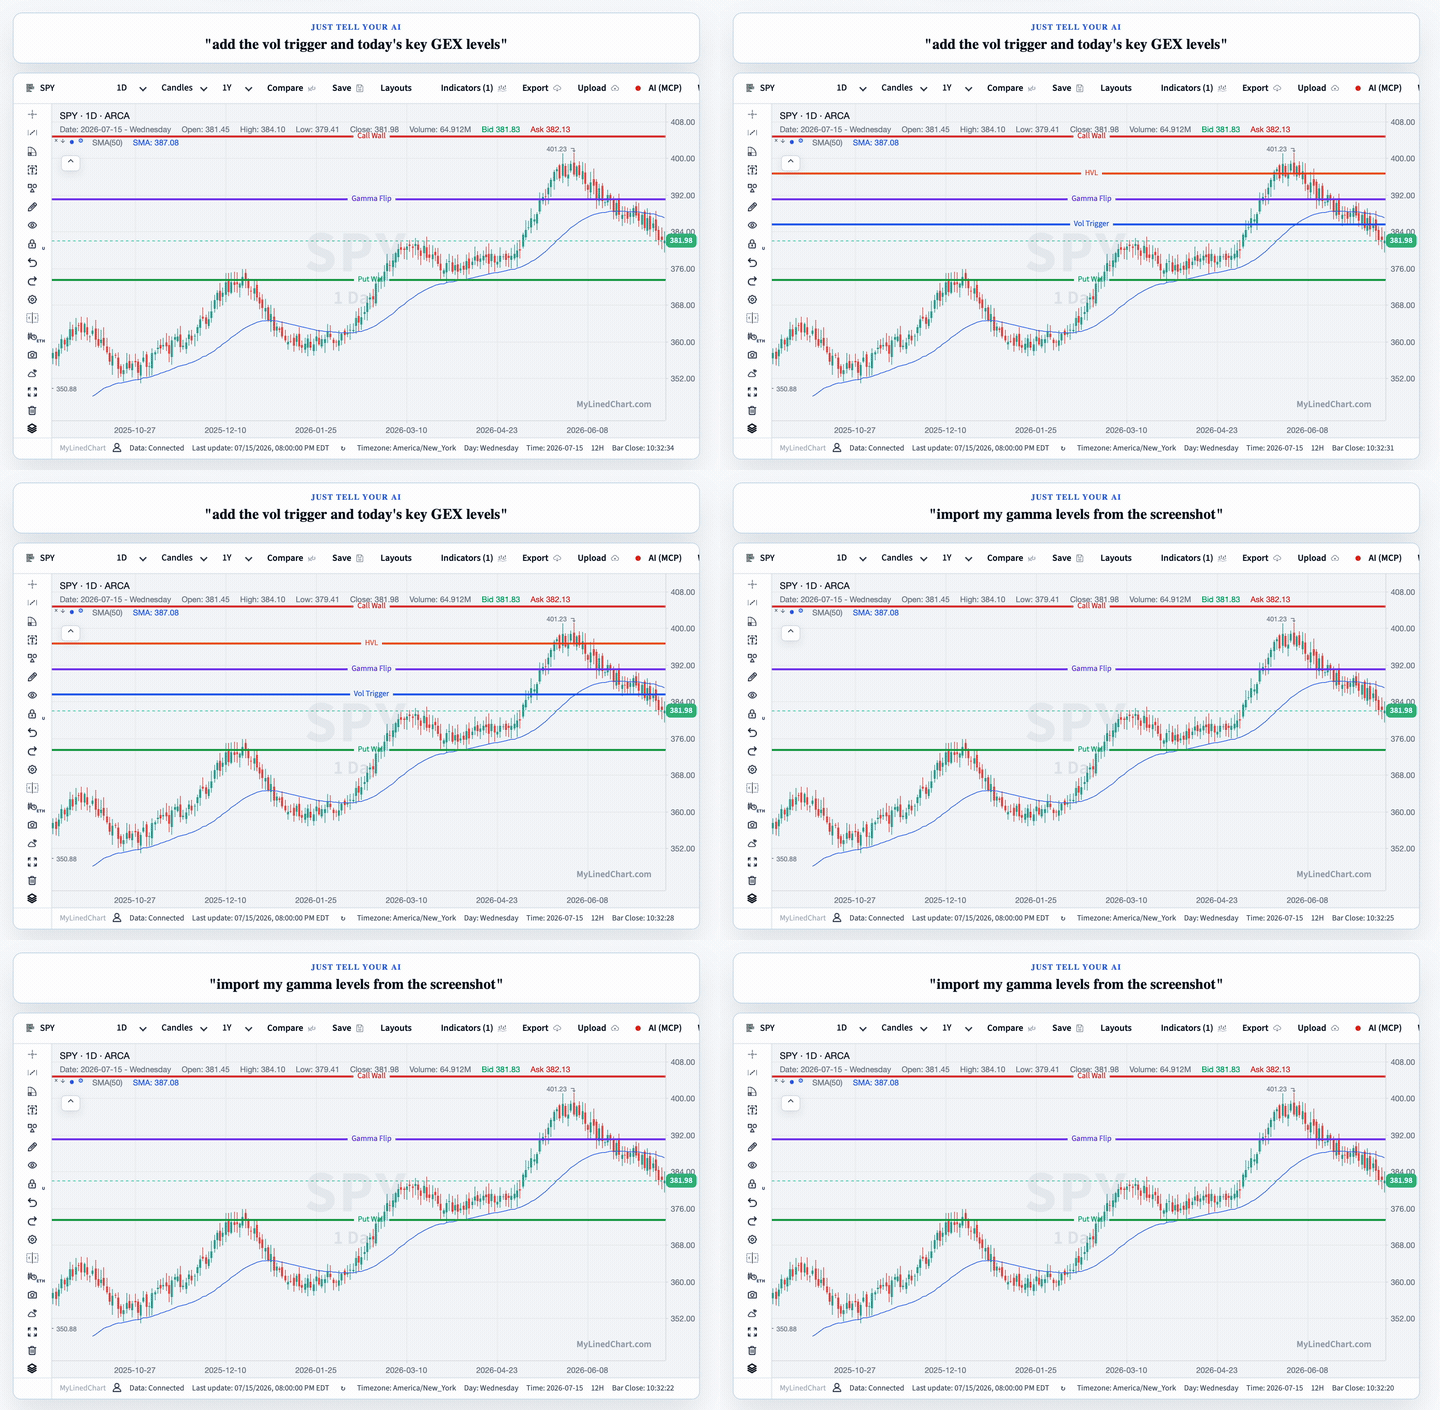
You already pay for the levels. MyLinedChart enables your AI to put them on your live chart, for IBKR, Schwab, Alpaca, or any provider, from a CSV, an API, or a screenshot.
The Daily Chore
Getting your provider's levels onto your chart usually means a daily chore: screenshot the dashboard and redraw each line by hand, or read the prices off and re-type them, every session before the open. That chore is busywork, and it is easy to fumble a level. MyLinedChart plus AI removes the chore. You point your AI at the data once, or hand it a screenshot, and the levels land on your chart, confirmed by you.
Point your AI at it, and it draws the levels on your chart. Works with SpotGamma's daily CSV, MenthorQ's API, Gexbot, Unusual Whales, SqueezeMetrics, and FlashAlpha.
Take a screenshot of the dashboard, your AI reads the numbers and draws them on your chart. Covers tools like InsiderFinance and GEXStream.
Read a level or two off, tell your AI, and it draws them. No files, no setup.
| Provider | Their format | Bring it to your chart via |
|---|---|---|
 SpotGamma SpotGamma | Daily CSV + platform integrations | AI pulls the CSV |
 MenthorQ MenthorQ | API | AI pulls the API |
 Gexbot Gexbot | REST API | AI pulls the API |
 Unusual Whales Unusual Whales | API (higher tier) | AI pulls the API |
 SqueezeMetrics SqueezeMetrics | Free CSV | AI pulls the CSV |
 FlashAlpha FlashAlpha | Free API and CSV | AI pulls the API |
 Volland (Addeum) Volland (Addeum) | Dashboard | Screenshot, AI reads it |
 GEXStream GEXStream | Dashboard | Screenshot, AI reads it |
 Perspicium Perspicium | Dashboard | Screenshot, AI reads it |
 InsiderFinance InsiderFinance | Dashboard | Screenshot, AI reads it |
 Tier1Alpha Tier1Alpha | Reports | Screenshot or type the levels |
All chart data dependent on your data subscription. No offer is being made or guaranteed on the accuracy of your data provider. Your credentials stay local to your device, they are never sent to MyLinedChart servers.
More Time Focused On Your Trading and Rules
Every one of these tools already plugs into TradingView, NinjaTrader, or Sierra Chart. None of them put your levels on your broker's native chart, IBKR, Schwab, Alpaca. MyLinedChart plus your AI ensures you stay focused on your trading and building your rules.
Once your provider's levels are on your chart, they export alongside your own drawings, notes, and trades as XLSX or JSON. Their levels and your analysis, in one structured record you can review, or hand to your AI.
FAQ
Yes, any gamma, GEX, or alt data source works. If it offers a CSV or API, your AI pulls it. If it is a dashboard, you screenshot it or read a couple of levels off, and your AI draws them.
No. You ask in natural language, and the AI handles the import and the drawing.
No. It only draws on your chart, every change is confirmed by you, and it never touches your account or orders.
Yes. You bring your own data. MyLinedChart brings it onto your chart.