Article
How to Turn Chart Notes Into Substack Articles Without Starting From Scratch
Use MyLinedChart to turn marked-up charts, notes, levels, and review context into a cleaner Substack article workflow.

Most traders already create useful article material while reviewing charts. The problem is that the material is scattered across screenshots, memory, journal fragments, and half-written notes. MyLinedChart helps preserve the chart context so the writing can start from evidence instead of a blank page.
The Core Workflow
The simplest workflow is chart markup, note capture, structured export, article outline, draft, and edit. The trader does the thinking on the chart. MyLinedChart helps keep that thinking attached to the levels, symbols, timeframes, and review notes that explain it.
That matters because a Substack article needs more than a chart image. It needs a clear setup, the decision point, the mistake or lesson, and a reader-friendly takeaway.
| Step | What the Trader Captures | How It Helps the Article |
|---|---|---|
| Chart markup | Levels, zones, drawings, labels | Creates the visual evidence |
| Notes | Setup reason, invalidation, observation | Creates the article argument |
| Export | Structured chart context | Keeps the draft grounded |
| Outline | Problem, example, lesson, next action | Turns review into a readable post |
Use a Repeatable Article Shape
Do not reinvent the structure every time. A trading article becomes easier to publish when each post follows a simple shape: what the chart showed, what the trader thought, what happened next, and what lesson should survive.
The goal is not to make every post identical. The goal is to remove the avoidable friction that stops traders from publishing after the review work is already done.
- Open with the chart problem or decision point.
- Show the level, setup, or behavior being reviewed.
- Explain what the note meant at the time.
- Translate the review into one useful lesson.
- Close with the next rule, checklist, or reader takeaway.
Where MyLinedChart Fits
MyLinedChart is useful because it keeps the chart story closer to the chart evidence. The notes, labels, levels, and drawings are not just visual decorations. They are the raw material for a better article.
That gives the writer a stronger starting point for Substack: a specific chart, a specific decision, and a specific lesson instead of a vague market recap.
FAQ
Can MyLinedChart write the Substack article for me?
MyLinedChart helps preserve and organize the chart context. The trader still owns the writing, editing, judgment, and publishing decision.
What should the first article be about?
Start with one chart lesson: a level that mattered, a setup that failed, a rule that improved, or a mistake that became clearer after review.
Do I need a complex publishing system?
No. Start with a repeatable outline and one chart example. Add more structure only after the workflow proves useful.
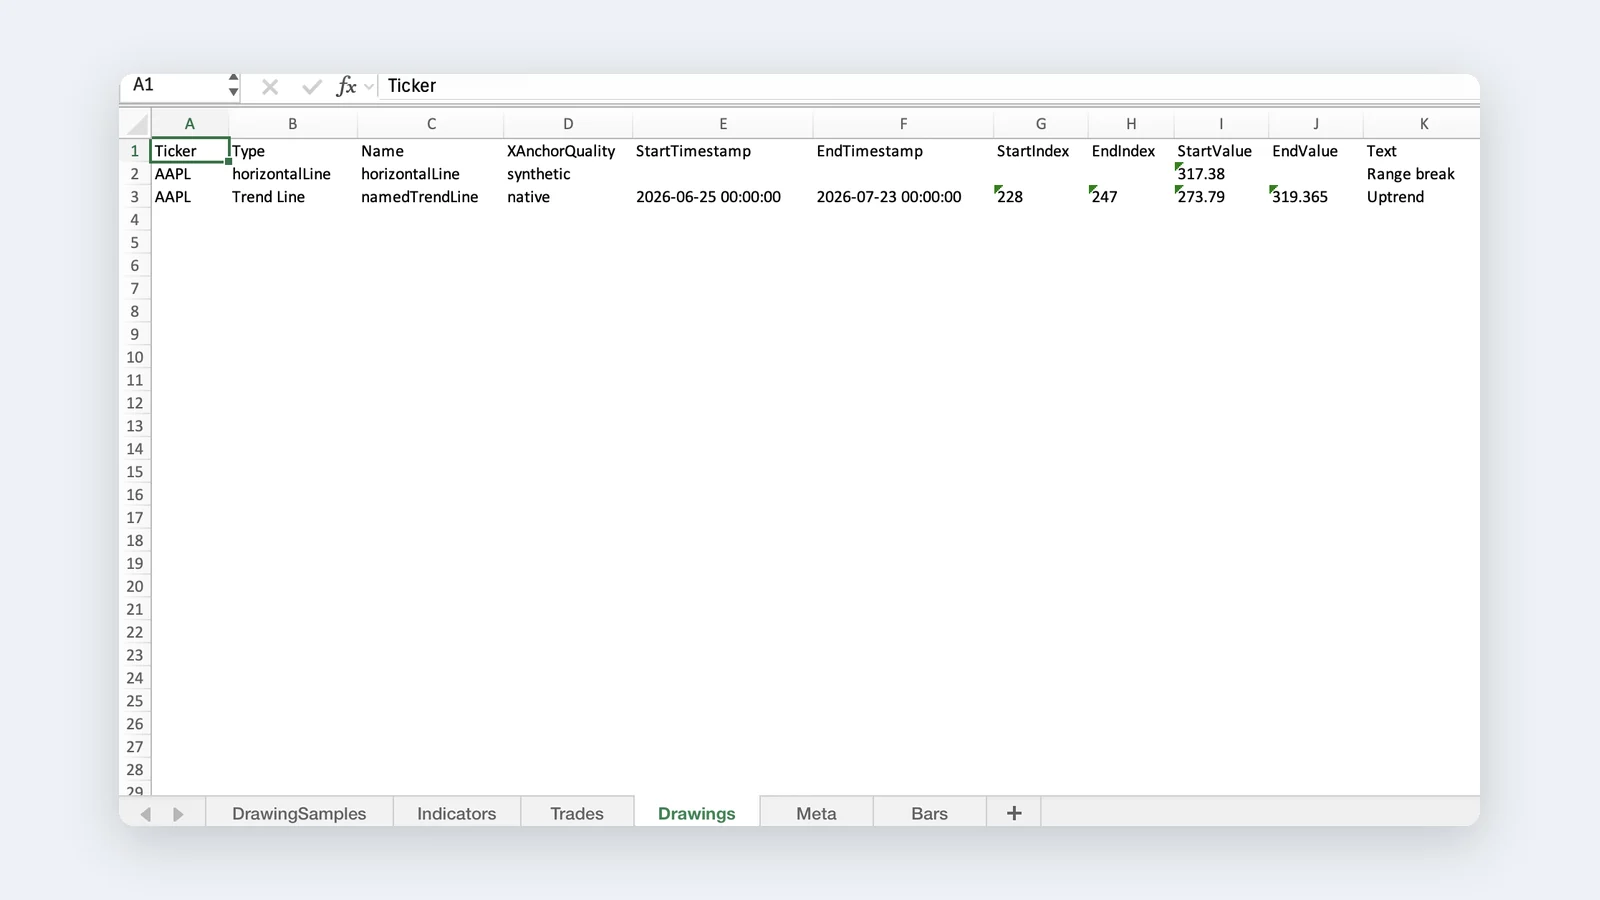
Sample Structured Chart-Data Exports
Review how chart drawings, annotations, OHLC, volume, and execution context become reusable structured data.