
Article
AI Headlines at Your Moving-Average Dates
MyLinedChart's AI Headlines indicator finds the exact bar each of your SMA lengths, 20, 50 and 200 by default, looks back to, and shows the headlines it can reach for that date. A small marker sits on the bar itself, a pill next to it shows the date and headline count, and tapping one opens a card with the actual headlines and an optional one-line AI summary, with only one card open at a time. It reads your IBKR news subscriptions over the MyLinedChart Connector first; if you have none, it names the exact dates it wants and the AI you already have connected can hand them over. A news-provider key is a third option, not a requirement. The AI summary describes the news only, never a prediction or a trading opinion.

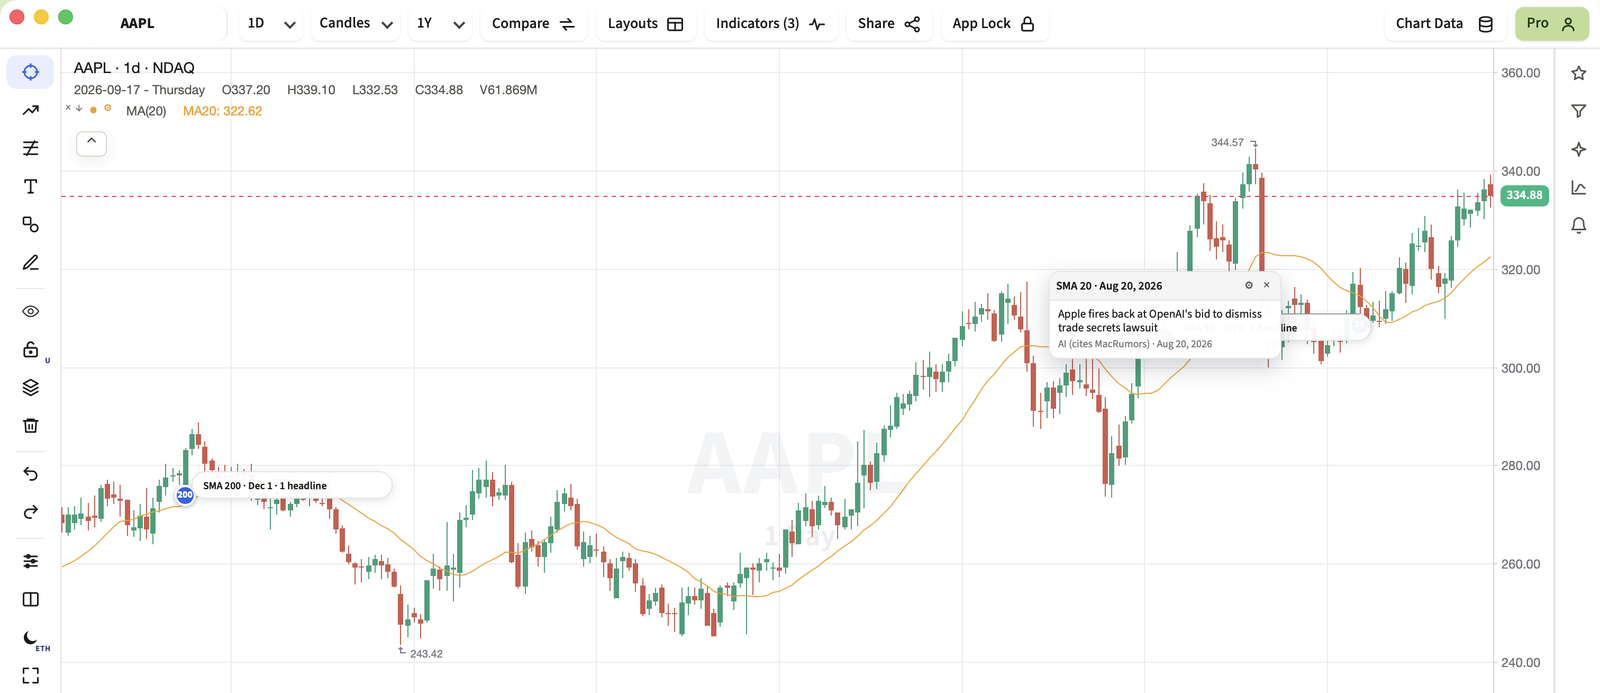
A 200-day moving average has a start date, the bar it first looked back to, and that date usually means something happened. AI Headlines at SMA dates puts a marker right on that bar and shows the headlines from around it, so the context sits on the chart instead of in a separate news tab.
How the Lookback Dates Are Picked
Every simple moving average has a start: the bar that many bars back from the latest bar on the chart, the first one its average actually includes. For an SMA(50) on the latest bar, that is the bar 50 back. AI Headlines computes that same bar for each SMA length you have configured, by default 20, 50 and 200.
If your loaded history does not reach back that far, that length is skipped rather than guessing at a date past the data you actually have. Two different lengths can land on the same bar on a short history, and the indicator shows both markers stacked rather than merging them, since that overlap is itself a real, meaningful outcome.
What You See on the Chart
Each lookback bar gets a small numbered marker sitting at that bar's own low, so the date reads as anchored to the actual candle rather than floating in a header row. Next to it, a compact pill shows the SMA length, the date, and how many headlines were found, for example "SMA 50 · Sep 3, 2026 · 3 headlines".
Tapping a marker or its pill expands a card connected to it by a thin line, showing the headlines with source and date, and the optional AI summary above them. Only one card is expanded at a time; tapping a different pill closes the first and opens the new one, and tapping the open card's own header collapses it back to just the pill. The card is positioned to stay clear of the newest bars and the chart's floating price label, flipping to whichever side of its marker has room.
Where the Headlines Come From
Sources are tried in a priority order rather than merged together. First the indicator asks your IBKR news subscriptions through the MyLinedChart Connector, using the feeds your own TWS or IB Gateway session is entitled to. If that returns nothing, it falls back to an AI you already have connected to the app. Only after both of those does it reach for a Finnhub, Alpha Vantage or Polygon key, if you happen to have entered one under Data Providers. Whichever tier answers first is the one rendered; the tiers are never mixed in a single card.
Nothing routes through a MyLinedChart server in any of those cases. The IBKR request goes out over the Connector running on your own machine, the news-provider request uses your own key, and the AI path is your own AI connection.
For each lookback date, the indicator keeps the two or three headlines closest to it within a several-day window, deduplicated when more than one source returns the same story.
When You Have No News Subscription At All
This is the ordinary case, and the indicator is built for it. Instead of a blank card or a demand for a paid key, it states exactly what it needs: the symbol, and the lookback dates behind each of your moving averages. On an AAPL daily chart with a 20, 50 and 200 setup, that reads as a single line naming those three dates.
An AI connected to MyLinedChart, whether Claude Desktop, Cursor, Codex or anything else that speaks to the app, can then hand those headlines back and they appear in the card. The app never pulls this by itself: that channel is agent-initiated, so nothing leaves and nothing arrives unless you ask for it in your own AI session.
Headlines that arrive this way are labelled AI rather than a wire name, and they carry no clickable link. The chart did not fetch the page, so it does not offer one.
The AI Summary
When headlines are found and an AI provider is already connected in the app, the card can also show one short, neutral sentence summarizing what those headlines were about. The prompt behind it explicitly asks for description only, no prediction and no buy, sell or hold opinion, and the app shows whatever the model returns without adding a call of its own.
The summary is optional and appears alongside the headlines themselves, never in place of them, so the raw sources are always there to read even if the summary is turned off or unavailable.
Turning It On and Settings
Enable AI Headlines at SMA dates from the Indicators menu like any other built-in indicator. Its settings, opened from the gear icon on an expanded card, let you change the three SMA lengths, filter which sources are shown once they start appearing, and turn the AI summary on or off.
This indicator needs the MyLinedChart app itself, not the browser edition, which does not carry the native connection it uses. It does not need a paid news subscription and it does not need a news-provider key; those are two of the three ways it can be fed, and the AI you already have connected is the third.
FAQ
How does AI Headlines decide which date to show headlines for?
For each SMA length you track, it finds the bar that many bars back from the latest bar on the chart, the same lookback start that length's own moving average uses, and shows headlines from around that bar's date.
Do I need to pay for a news feed?
No. The indicator tries your IBKR news subscriptions first if you have any, then the AI you already have connected to the app, and only then a Finnhub, Alpha Vantage or Polygon key. With none of those subscriptions, the AI path costs nothing extra.
How does the AI get headlines onto the chart?
The card names the symbol and the exact lookback dates it wants. You ask your connected AI for headlines around those dates, and it pushes them back into the card through the app's write channel. The app never fetches this itself.
Why do AI-supplied headlines have no link?
Because the chart did not fetch the page. It shows the headline, the date and the source the AI cites, labelled AI, rather than offering a link it cannot verify.
Can I have more than one headline card open at once?
No, only one card is expanded at a time. Tapping a different marker or pill closes the current card and opens the new one.
Does the AI summary give a trading opinion?
No. It is limited to one neutral sentence describing what the headlines were about, and the prompt behind it explicitly excludes a prediction or a buy, sell or hold opinion.
Does this work in the browser edition of MyLinedChart?
No, it needs the app itself. The browser edition does not carry the native connection this indicator uses.
Sample Structured Chart-Data Exports
Review how chart drawings, annotations, OHLC, volume, and execution context become reusable structured data.