
Article
Import a TradingView Pine Script
TradingView Pine Script indicators can now come into MyLinedChart directly. The Formula panel's Import option reads a .pine file and converts the part of the script it understands into a MyLinedChart formula indicator, named from the script's own indicator() title and placed on the price chart or in its own pane based on the script's overlay setting. It converts a real subset of Pine, covering inputs, moving averages, RSI, crossovers, arithmetic, comparisons, and/or logic and a ternary plot, and reports everything else by line number instead of dropping it silently.

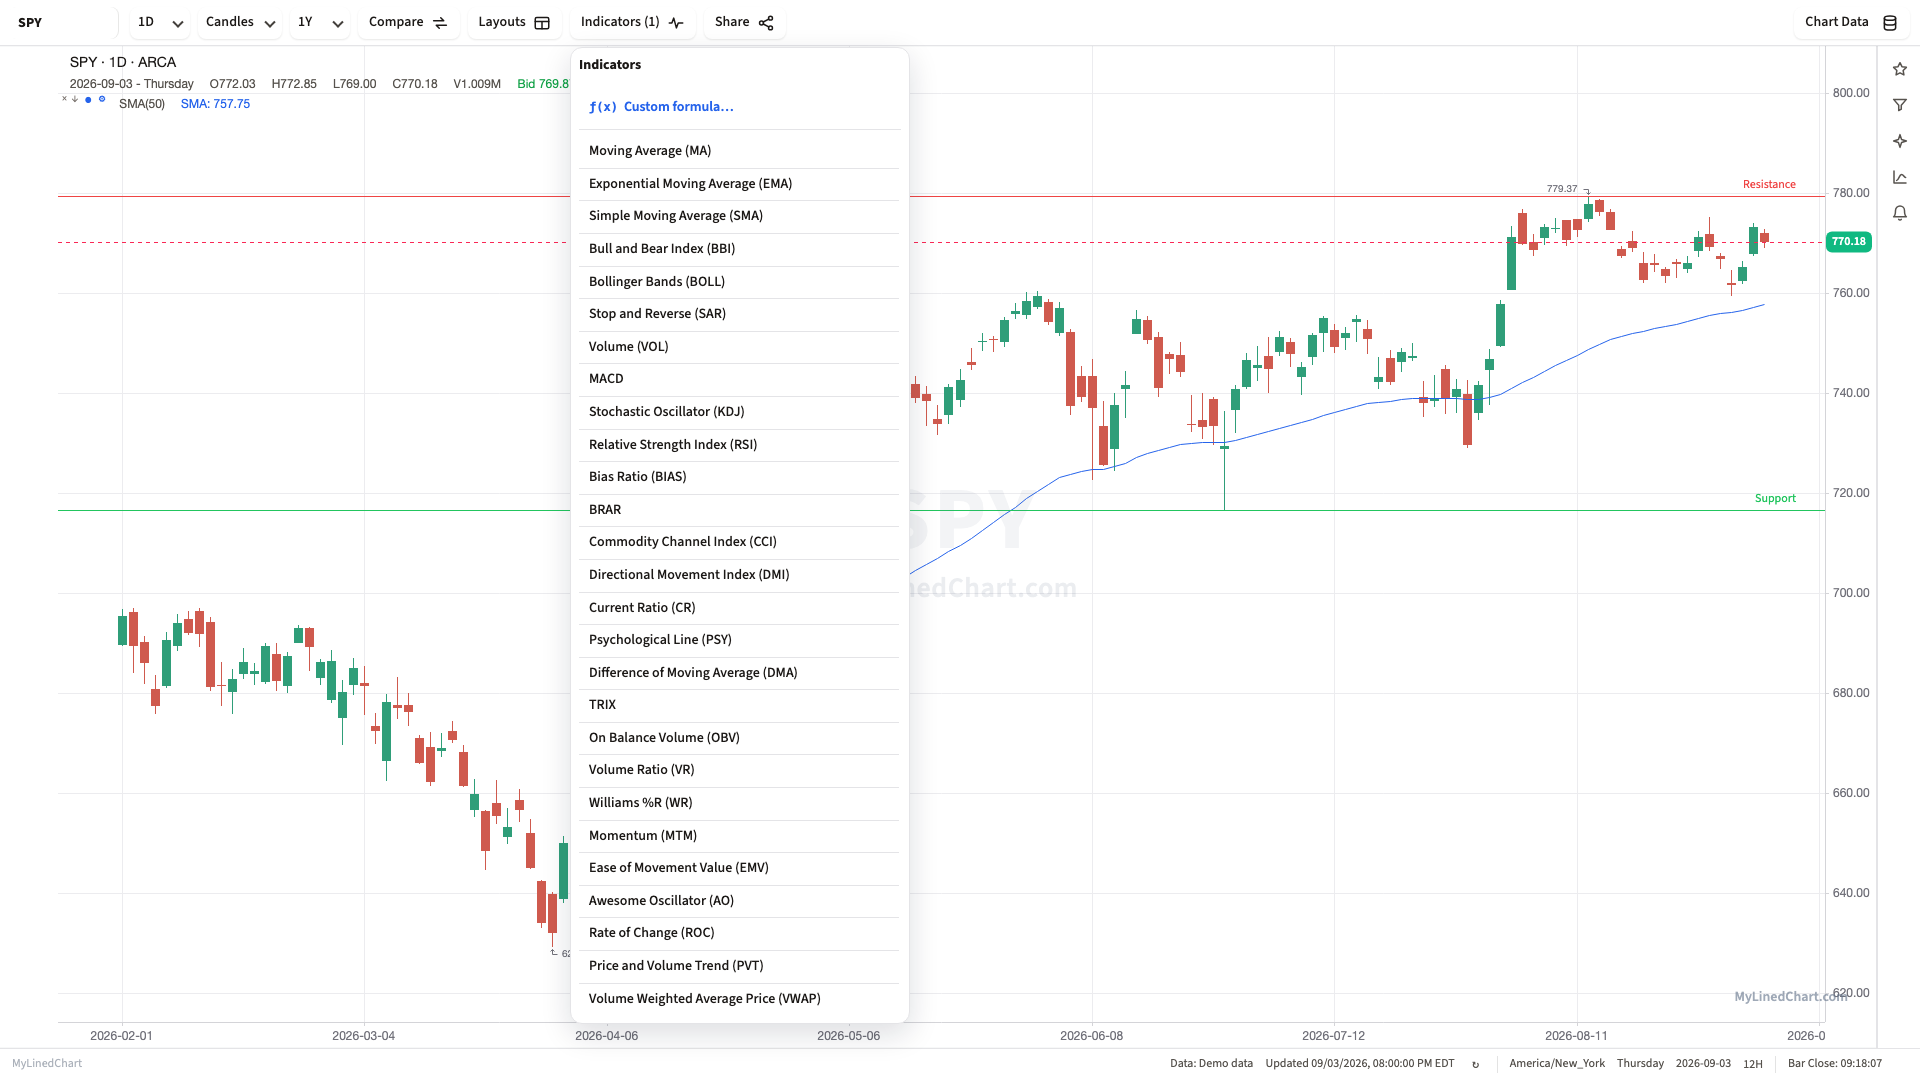
Rebuilding a TradingView indicator from scratch is tedious even when the logic is simple: an EMA cross, an RSI filter, a spread between two averages. MyLinedChart's Formula panel now has an Import option that reads a .pine file directly and converts what it can into a working formula indicator, so a script you already trust does not have to be retyped by hand.
How the Import Works
Open the Formula panel and choose Import, then pick a .pine file from your computer. The conversion runs inside the app itself; nothing is uploaded anywhere to convert it.
If the script converts cleanly, it appears as a new formula indicator using the title from the script's own indicator("...") or study("...") call. A script with no title falls back to the file name.
The script's overlay argument decides where the result lives. overlay=true opens it on the price chart, alongside candles. overlay=false, which is also Pine's own default when overlay is left out entirely, gives it its own pane below the chart, the way an oscillator like RSI or MACD would sit.
What Converts
The converter targets MyLinedChart's own formula language, an expression grammar with no assignment, loops or strings, so every Pine variable is inlined by substitution rather than kept as a variable. Inside that limit, it understands a genuine range of Pine constructs.
| Pine construct | Comes across as |
|---|---|
| input.int, input.float, input.bool, input.source, input.string, input.timeframe | The input's default value, folded into the formula as a constant |
| ta.sma, ta.ema, ta.wma, ta.rsi, ta.stdev, ta.highest, ta.lowest, math.sum, math.abs, math.min, math.max | The matching MyLinedChart window function, with the same lookback length |
| ta.crossover(a, b), ta.crossunder(a, b) | The equivalent crossing condition in MyLinedChart's own grammar |
| and, or, not | Plain arithmetic: and becomes multiplication, or becomes max(), not becomes 1 minus the value, since the target language has no boolean keywords of its own |
| A ternary such as cond ? a : b as the plotted value | A ternary expression in the converted formula |
What Gets Reported Instead
A construct the converter cannot express is never guessed at or quietly dropped. It comes back in a list with the line number and the reason, and the import is refused rather than shipped half-finished. The most common reasons:
- strategy.* calls: these place orders and run a backtest, and the formula box only computes one number per bar.
- for and while loops, plus array.*, matrix.* and map.* calls: the target is an expression language with no iteration or collections.
- => user-defined functions, and := reassignment: there are no variables to reassign, only substitution.
- alertcondition(): use the app's own Alerts panel for that instead.
- request.financial, request.dividends, request.earnings, request.splits and similar external data requests: not available to a formula.
Try It: an EMA Spread
A sample script is available at /samples/ema-spread.pine to try the converter without writing any Pine first. It reads indicator("EMA Spread", overlay=false), two input.int declarations for a fast and slow length, two ta.ema() calls, and plot(fastEma - slowEma).
Importing it creates a formula indicator named "EMA Spread" in its own pane, since overlay is false, that plots the distance between a 20-period and 50-period EMA: positive while the fast average leads, negative while it lags, crossing zero exactly where a classic EMA cross would fire.
Every construct in that file, input.int and ta.ema, is inside the subset above, so it converts in full. The result still has to fit the formula engine's own limits, 500 characters, 100 nodes and a window cost of 2000. A short script like the EMA spread sample is nowhere near any of them; a long Pine script with several stacked moving averages can be.
FAQ
What happens to parts of my Pine script the converter cannot express?
They are reported by line number with the specific reason, and the formula is withheld rather than imported partially. Nothing is silently dropped or guessed at.
Do I need a TradingView account to run an imported indicator?
No. Once a script converts, it is an ordinary MyLinedChart formula indicator, computed by the app's own formula engine. TradingView is only needed to have written the .pine file in the first place.
Can I import a Pine strategy script?
Only the pure calculation around it, if any. strategy.* calls that place orders or run a backtest have no equivalent in a formula box that only computes one number per bar, and are reported rather than converted.
Where does an imported indicator open, the price chart or its own pane?
Wherever the script's own overlay setting says. overlay=true opens it on the price chart with candles; overlay=false, Pine's own default, gives it its own pane below the chart.
Sample Structured Chart-Data Exports
Review how chart drawings, annotations, OHLC, volume, and execution context become reusable structured data.